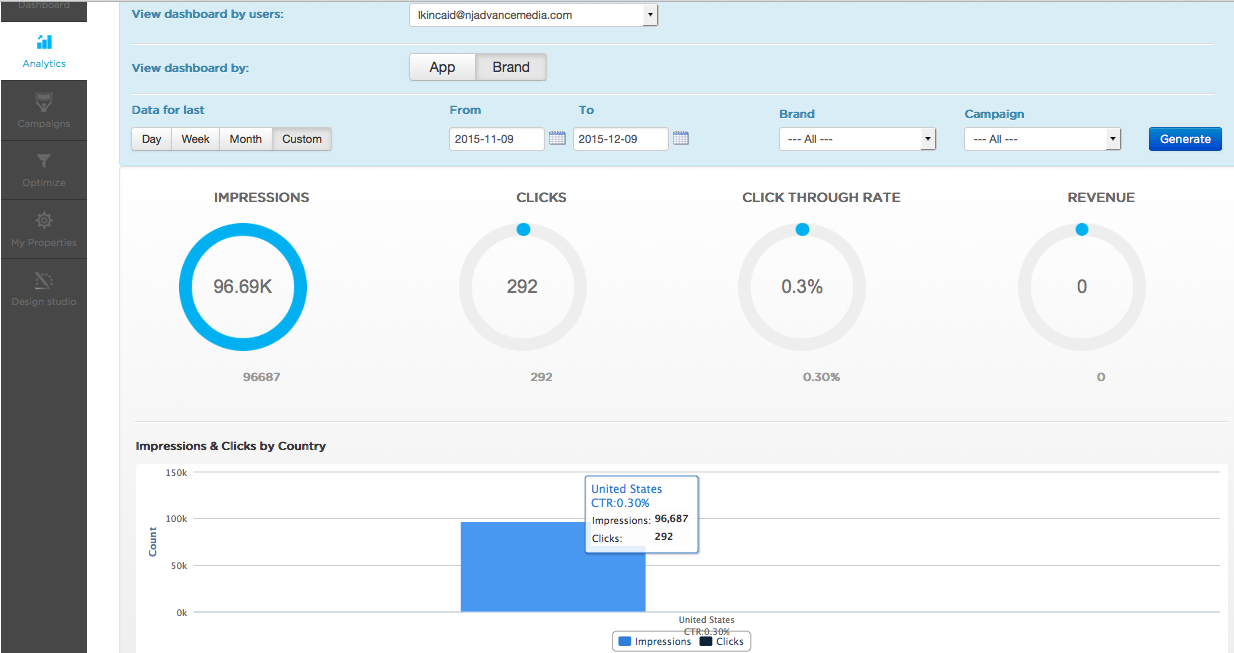
Overview, by default, displays aggregated Impressions, Clicks and Click through rateacross all user campaigns (along with it’s country-wise distribution).
User can – a) Choose the date range for which they want to see the data (by default it is for last 30 days) and also b) Choose a campaign to see campaign specific data
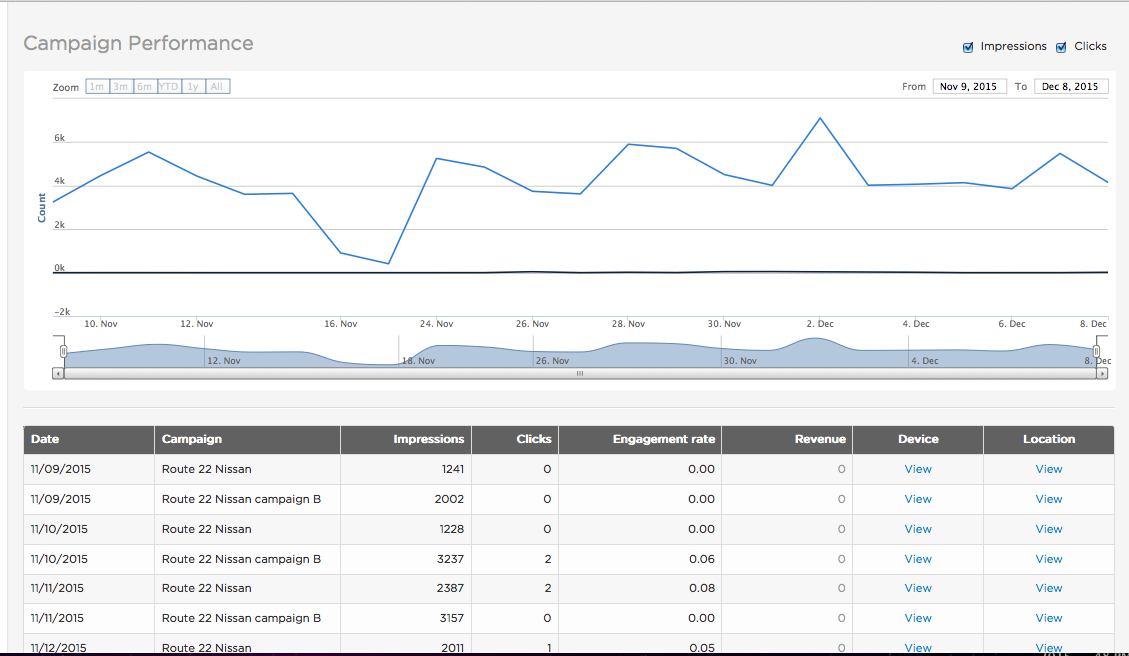
This tab displays dailyperformance of campaign(s) over the selected date range. Along with the daily impression and click data, user can also drill down and see the impression / click distribution, by device and by location.
User can – a) Choose the date range for which they want to see the data (by default it is for last 30 days) and also b) Choose a campaign to see campaign specific data.
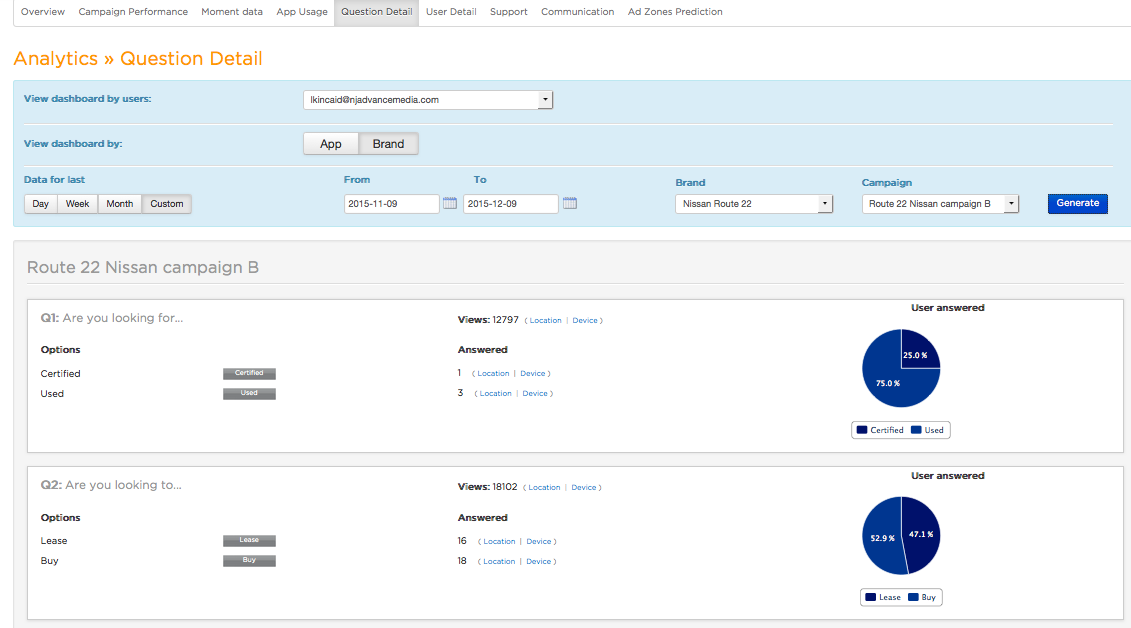
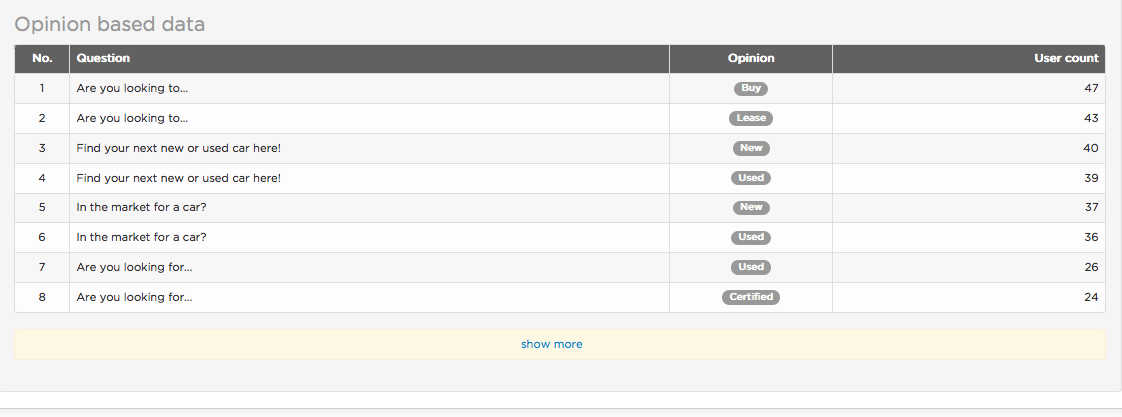
This tab displays user opinion data for each question of your Question-Answer campaign (along with question views).
User should select – a) The date range for which they want to see the data (by default it is for last 30 days) and b) Choose a campaign to see campaign specific opinion data
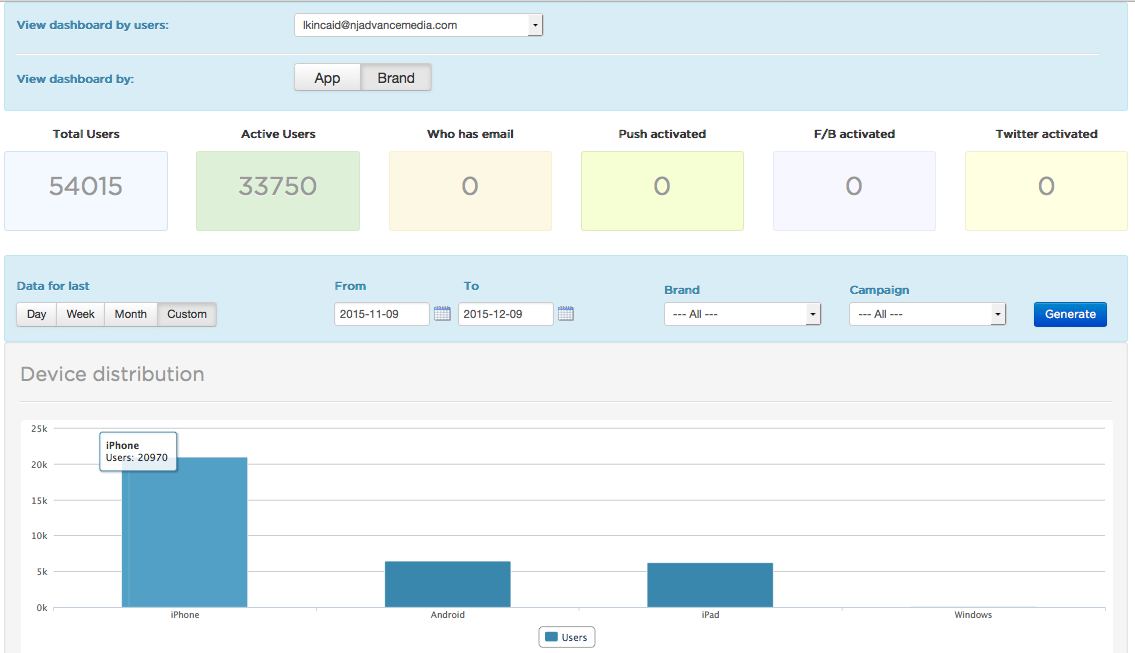
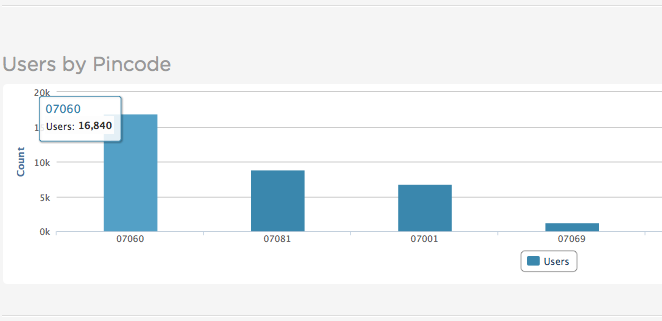
This tab displays aggregated user data for your app(s) / brand(s). User data includes – Total users, Active users, Users by device, Users by country, Users by Pin codes and Overall user opinion data.
User can select a date range to get user data over a specific period and / or select a campaign to get campaign specific user data.
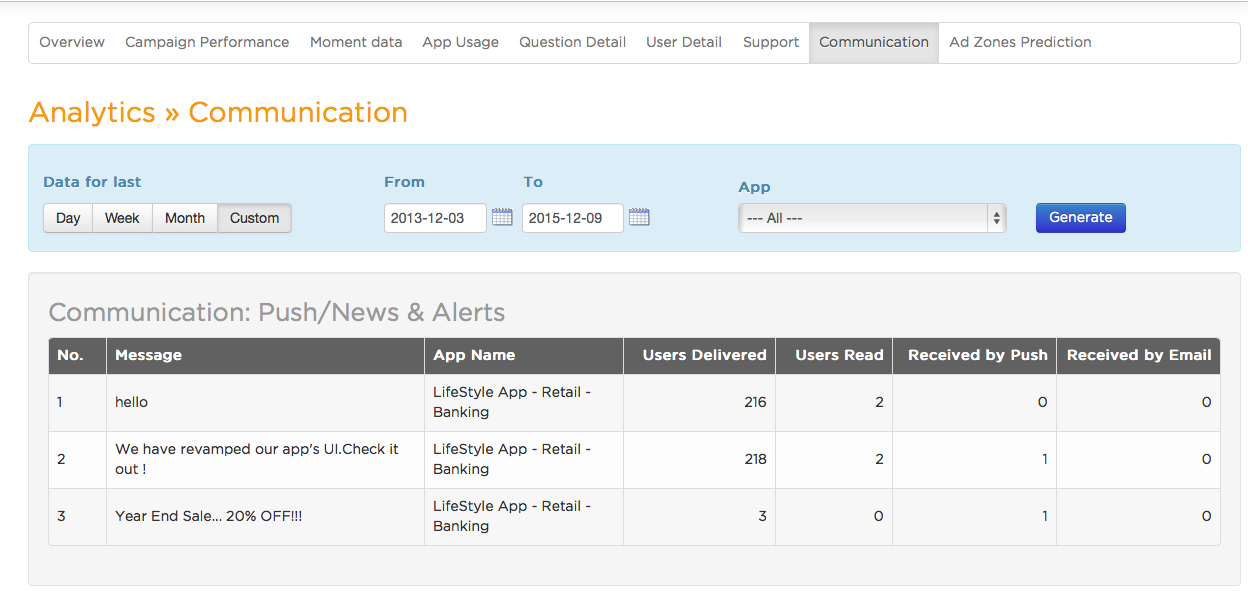
This tab displays data on messages delivered – In-App, Push or Email.
User can select the date range and app for which they want to see the message data
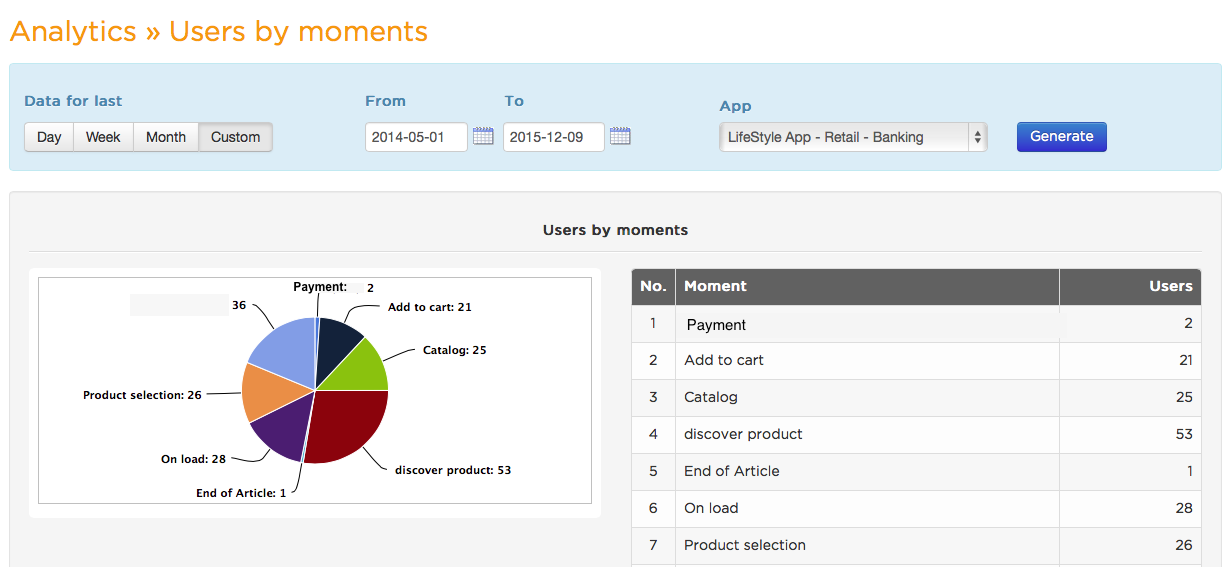
This tab displays occurrence of moment(s) by unique users (during app/website usage).